Executive Dashboard with Data Visualization and Admin Interface
The goal of this project was to design and develop an executive dashboard that provided real-time insights into key business categories through interactive data visualizations. This dashboard would empower executives and stakeholders to make informed decisions by presenting critical metrics in an accessible, visually engaging format.
Key Features:
Executive Dashboard:
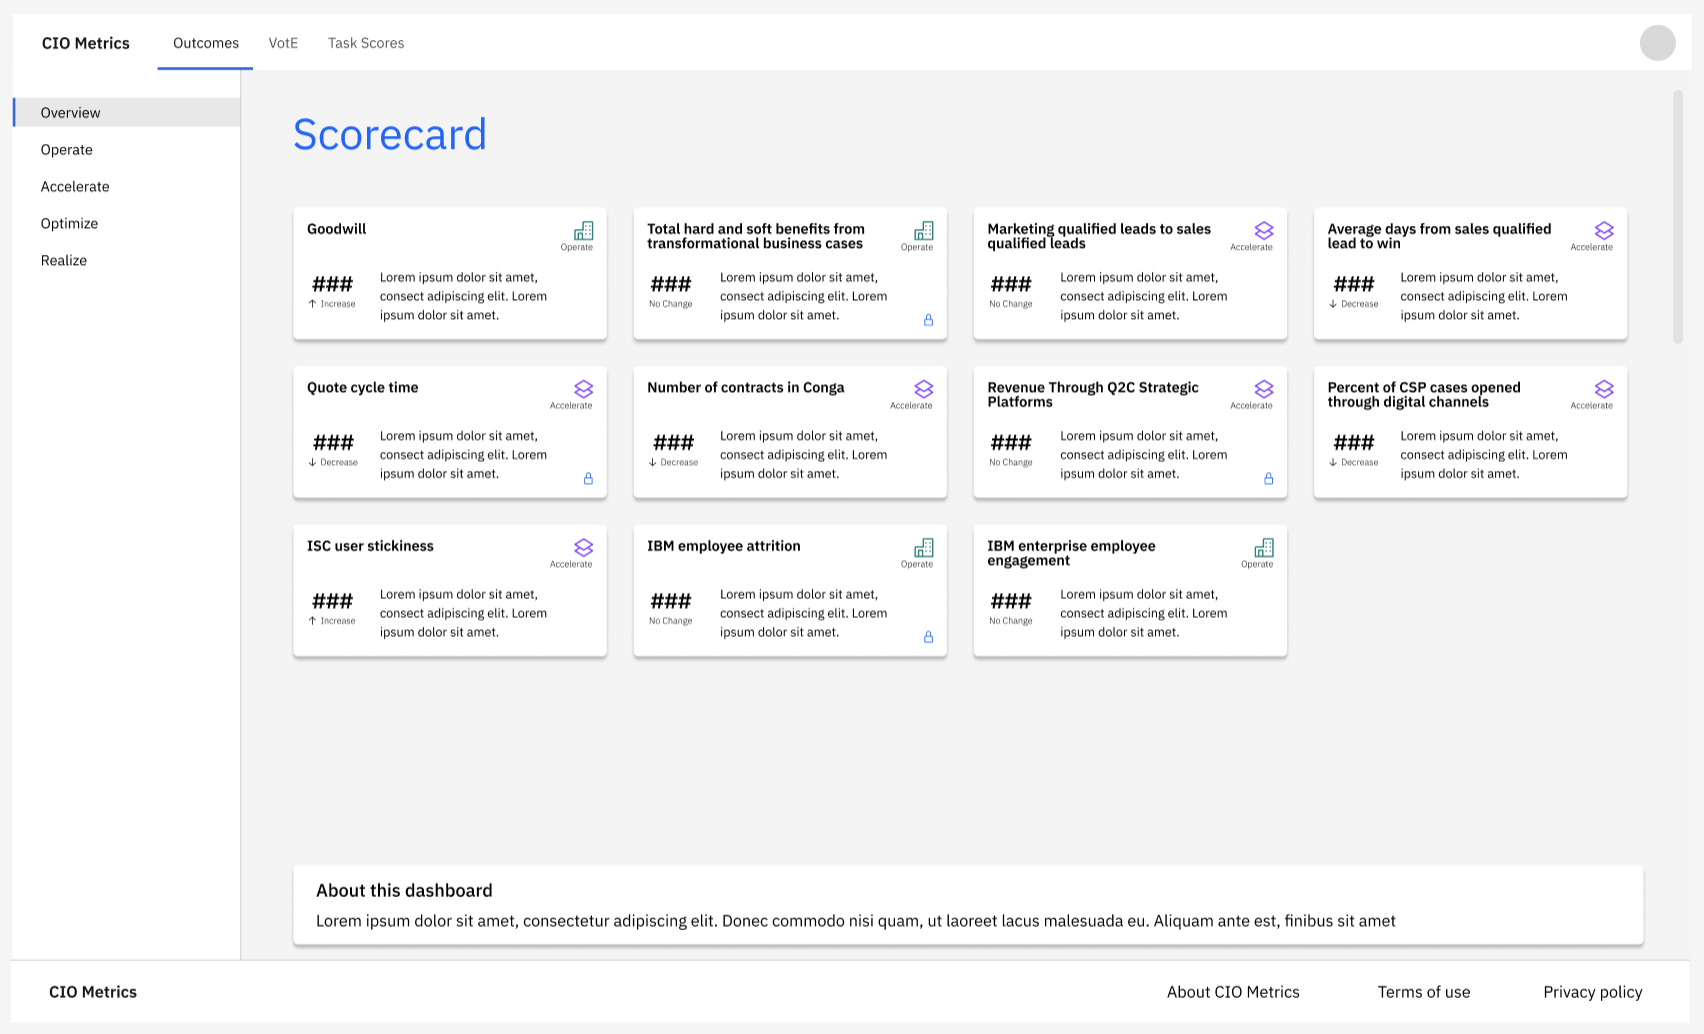
Key Metrics Display (“Scorecard”): Highlights essential data points across high profile categories. Customizable to each executive’s desired view.
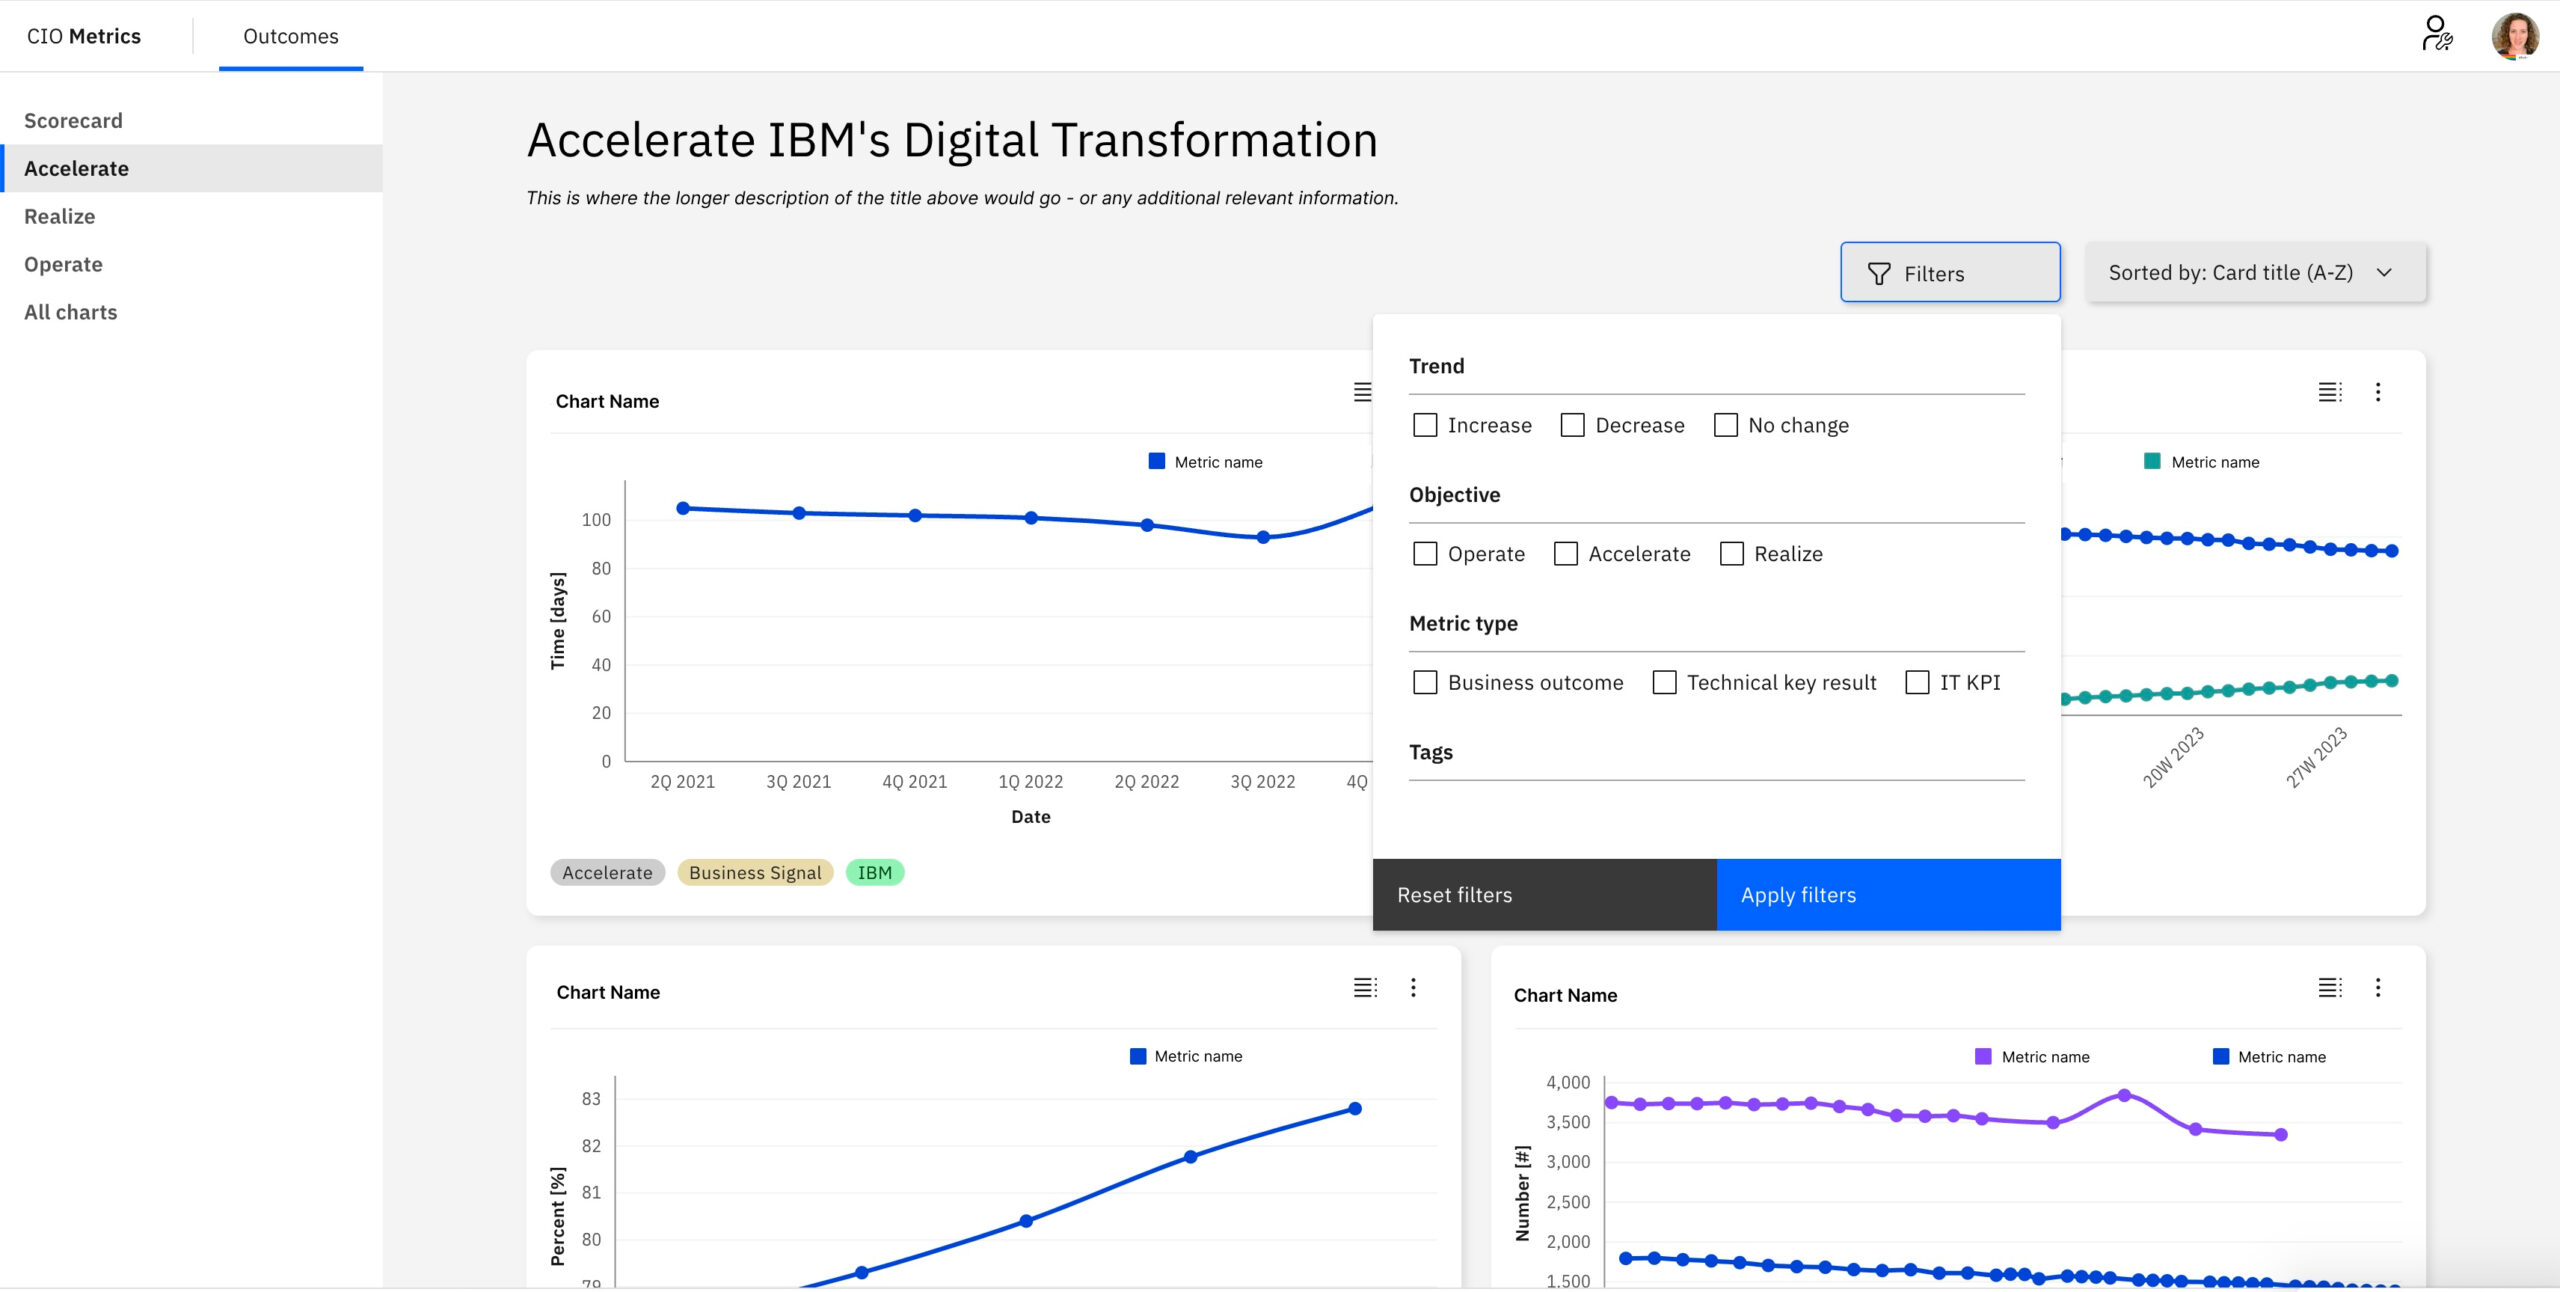
Data Visualization: Interactive card, charts and graphs used to identify trends and patterns quickly.
Customizable Views: Users can filter, sort, and drill down into specific metrics for deeper insights, as well as customize their individual views so that high priority metrics can be surfaced first.
Mobile & Desktop Compatibility: Ensures accessibility across devices with responsive design, for on-the-go decision-making.
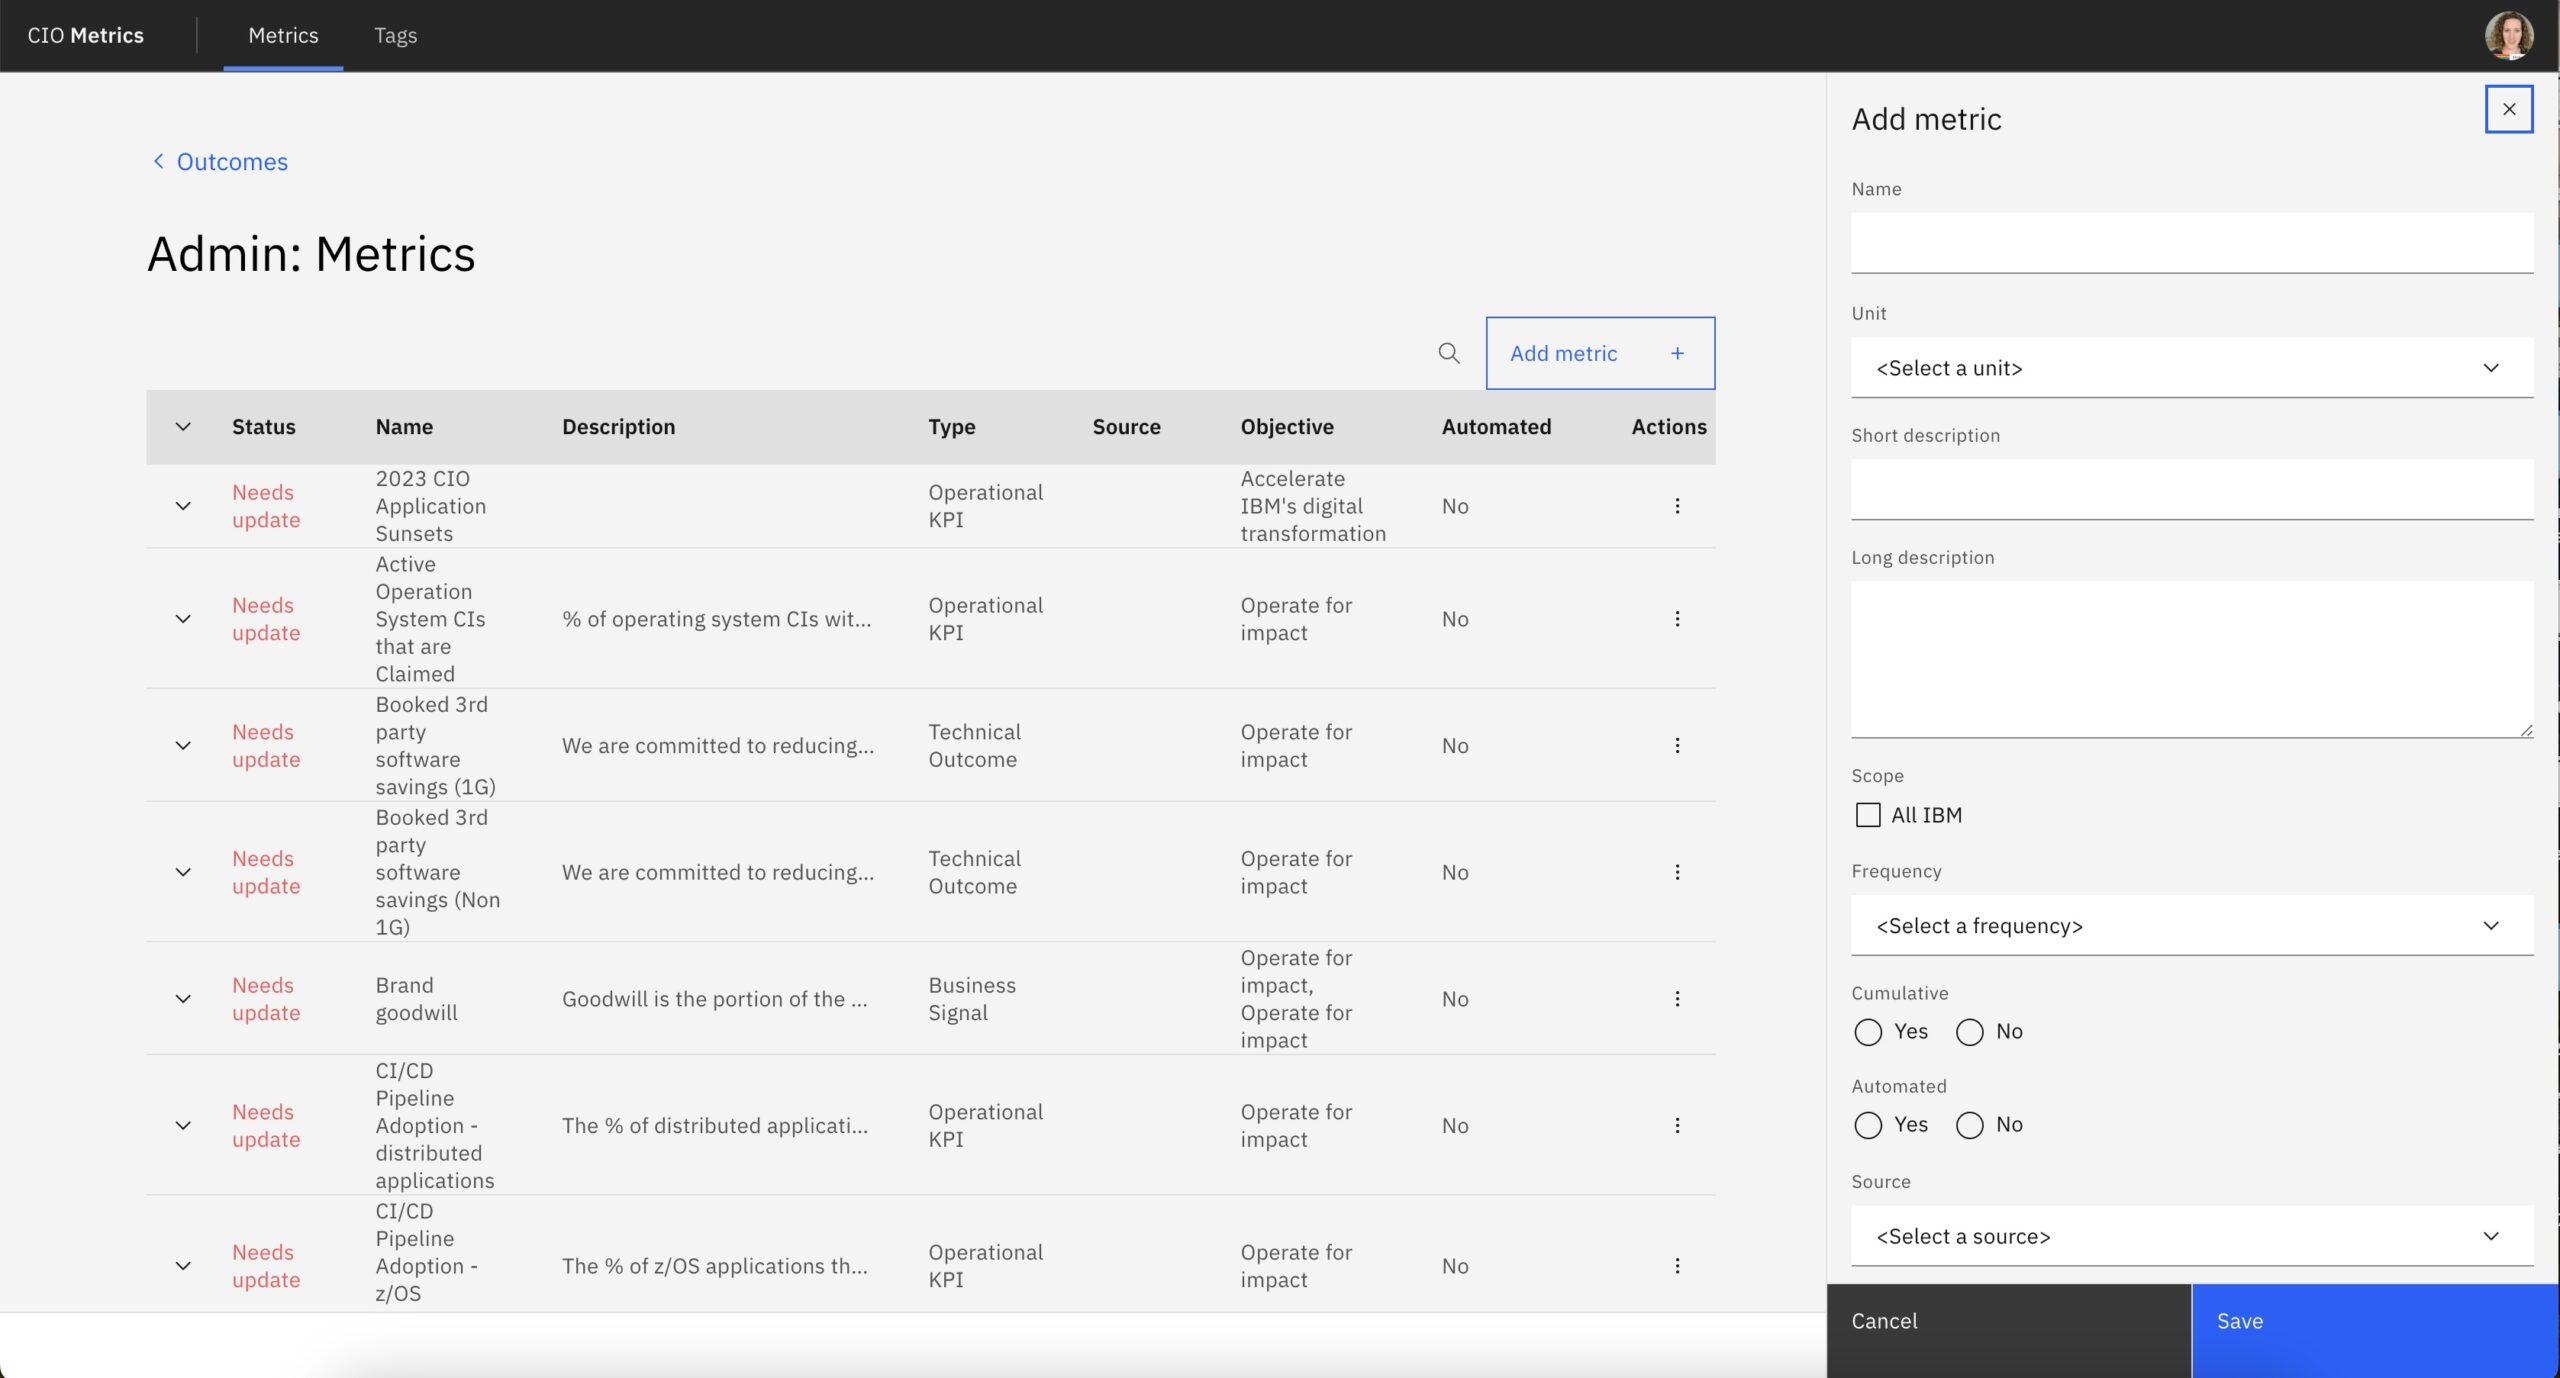
Admin Interface:
Visualization Management: Enables admins to create, edit, and organize data visualizations for the executive dashboard.
Metric Creation & Updates: Allows for the addition of new metrics or modification of existing ones, including data source configurations.
User Access Control: Manages roles and permissions to ensure data security and tailored user experiences.
Template Library: Provides predefined templates for visualizations to standardize presentation styles.
Deliverables:
Fully functional executive dashboard with real-time insights.
Comprehensive admin panel for managing visualizations and metrics.
Documentation and training materials for users and administrators.
Deployment and post-launch support.
This solution was intended to streamline decision-making by centralizing key business metrics and offering flexible tools for managing and analyzing data.